ILDN collects a large amount of data from its receivers, over and above that required for routine lightning location activity. This information is available for non-commercial use, free of charge online or at media cost for bulk data.
To request access, please contact Anirban Guha, anirbanguha[at]tripurauniv.ac.in.
Access to most datasets is via a scriptable web API or via an SSH client to a shell API. In some cases ILDN may arrange a custom API to meet your requirements.
The following sections of this page describe in broad terms the kinds of data available from ILDN.
A large quantity of lightning stroke and flash data, individual records and density statistics, is available. The data extends downwards to the individual sferic records and upwards to flash records and stroke density data.
Stroke, flash, and sferic data is available for download in daily flat files, or in a structured hierarchical (JSON) format.
An almost-live feed (3 minutes latency) of stroke data can be accessed by SSH. Random access to individual stroke and flash records, searchable by timestamp and geographic coordinates, is also available.
All the ILDN receivers continuously monitor the VLF band with an automatic detector to capture events such as whistlers, auroral chorus, triggered emissions and other types of riser signals.
Captured events are all manually inspected for confirmation of the automatic detection, before committing to the database.
Recent events can be viewed on our Events Gallery.
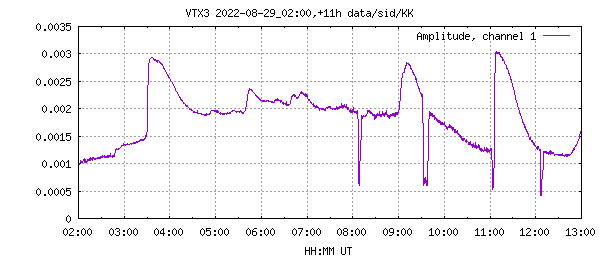
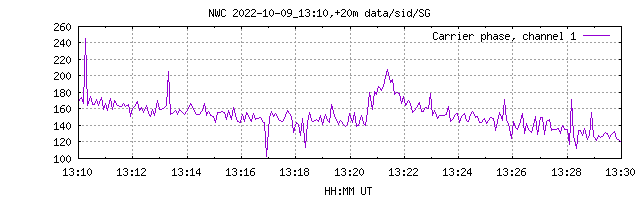
Each ILDN receiver monitors a selection of Naval MSK signals to look for sudden ionospheric disturbances (SIDs) caused when solar flares and other X-ray events affect ionisation of the D and E regions of the ionosphere.
Stations monitored are:
| Transmitter | Frequency | Notes |
|---|---|---|
| VTX3 South Vijayanarayanam, 8.387N,77.753E | 18.2 kHz | Amplitude only, unstable carrier frequency |
| NPM Pearl Harbour, 21.420N,158.151W | 21.4 kHz | Amplitude only, too weak for reliable MSK phase |
| NDT Ebino Japan, 32.082N,130.828E | 22.2 kHz | Amplitude only, too weak for reliable MSK phase |
| NWC Exmouth Australia, 21.816S,114.166E | 19.8 kHz | Amplitude and phase |
The stations listed are monitored at 5 second resolution.
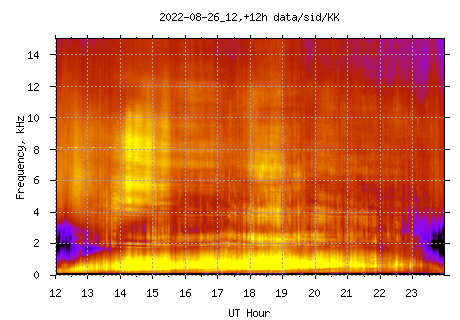
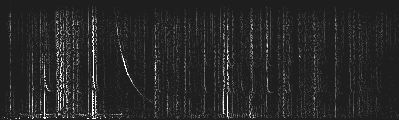
At each receiver, the VLF spectrum from 500Hz to 48kHz is captured every 2 minutes with a frequency resolution of 5.86 Hz.
This data can be used to construct wide band and long period spectrograms revealing the mode spectrum of the Earth-ionosphere waveguide.
Near real time VLF (about 15 seconds latency) signal is available for live streaming using Vorbis encoding multiplexed with a parallel timestamp channel in a Ogg container.
A custom signal stream can be arranged to multiplex any combination of receivers aligned on timestamp. VLF channels can be full bandwidth, or a selected sub-band.
Typically, the signal streams are filtered to remove power line and other anthropogenic interference, and calibrated to a full scale of 0.3V/m field strength. Raw signal is also available if required.
ILDN can assist with preparation of A/V media such as maps, images, and animations of various kinds. Let us know your requirements for pedagogical or documentary media.
The embedded operating system (Linux) with the receivers is designed to provide a platform for ad hoc data collection for research projects, potentially supporting many fields - climate, meteorology, geophysics, ionosphere and magnetosphere studies, and the broad field of space weather. Precision measurements of the VLF E-field can provide useful observational support in all of these areas.
Sferic measurements and lightning location, plus all of the continuous data collection listed earlier on this page, consumes 30% of the receiver's processing capacity.
ILDN welcomes suggestions to usefully deploy some of the idle 70% to make the most of this unique resource.